-1.png?width=200&height=51&name=LM_NuBlu_Horiz_Hi%20(1)-1.png)
When you want to continuously monitor fleets and their behavior month after month, you need some reports that help get data to measure KPIs or tracking metrics.
Below we will show 5 of the most used reports and how to create them in MC.
5 Reports:
- Reservation per month
- # of Vehicles
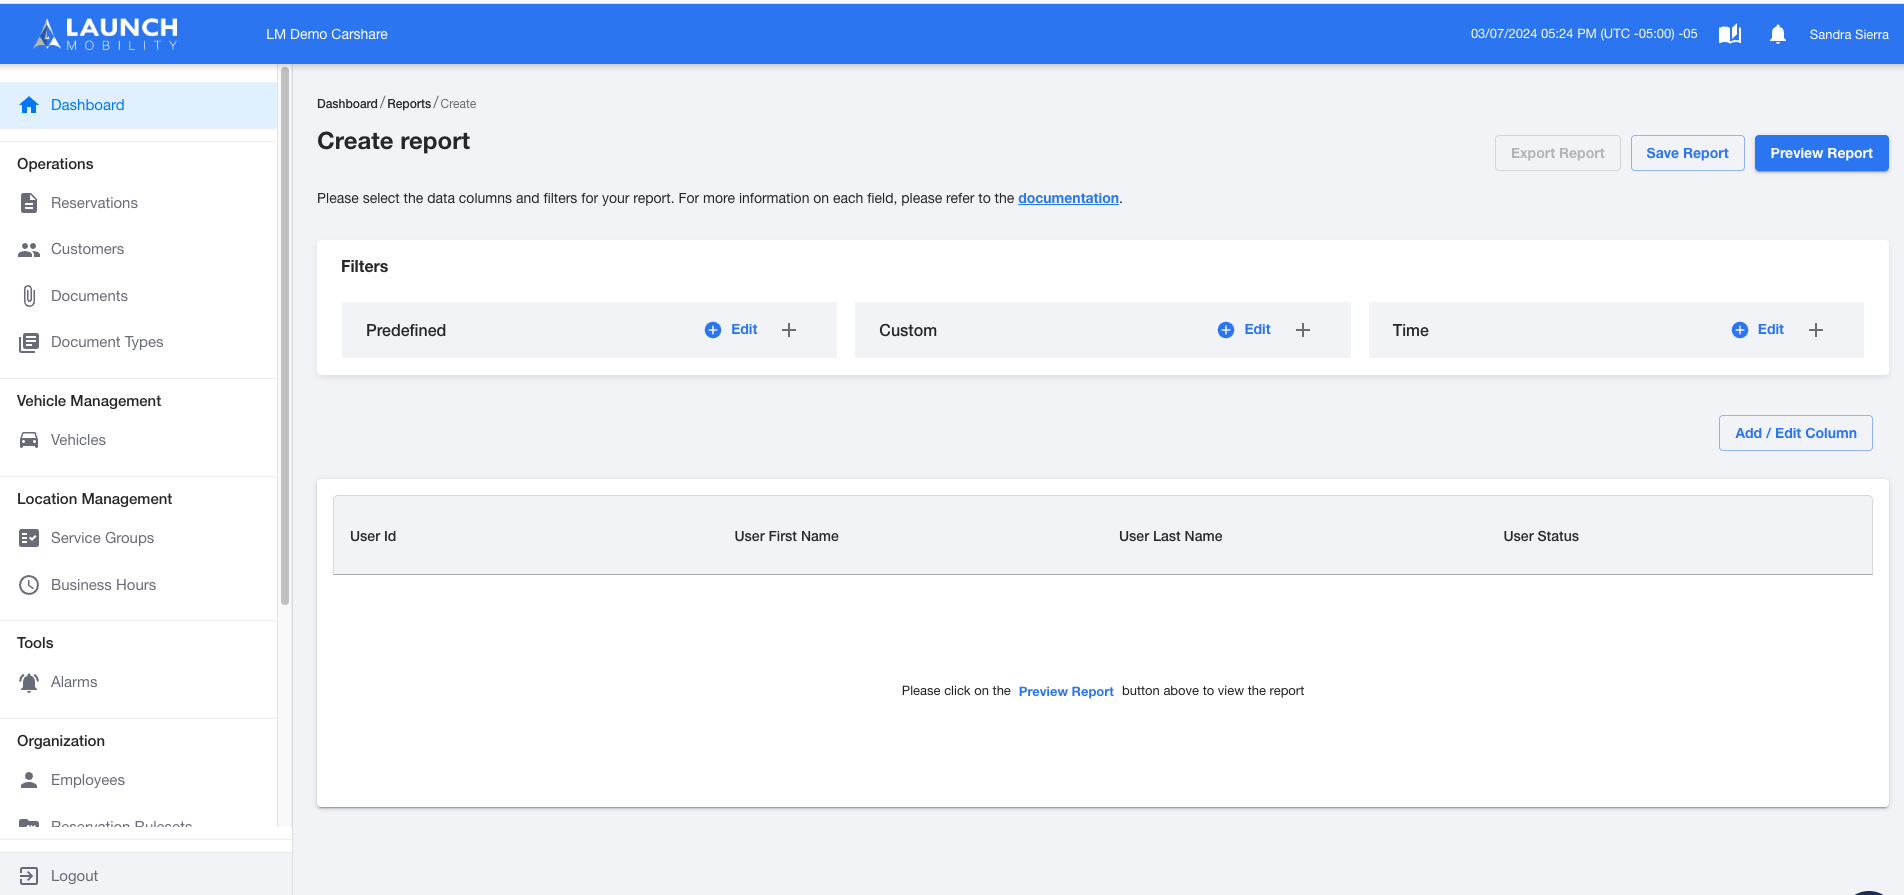
- Total of Customers
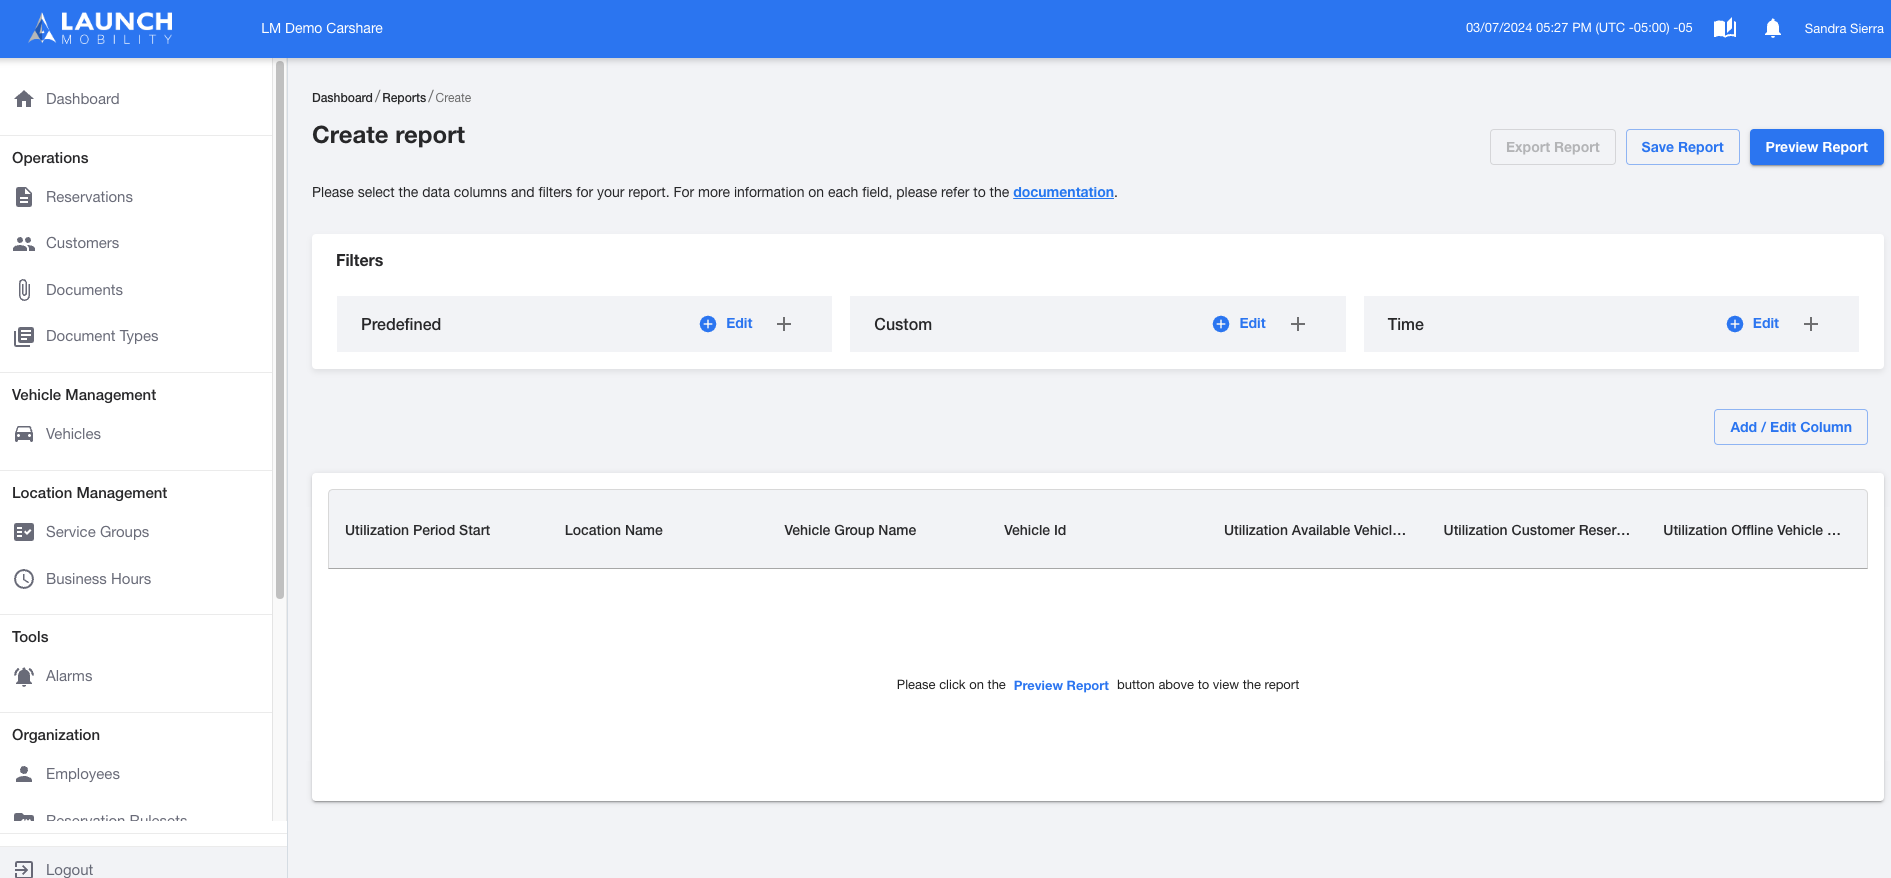
- Utilization/ Location
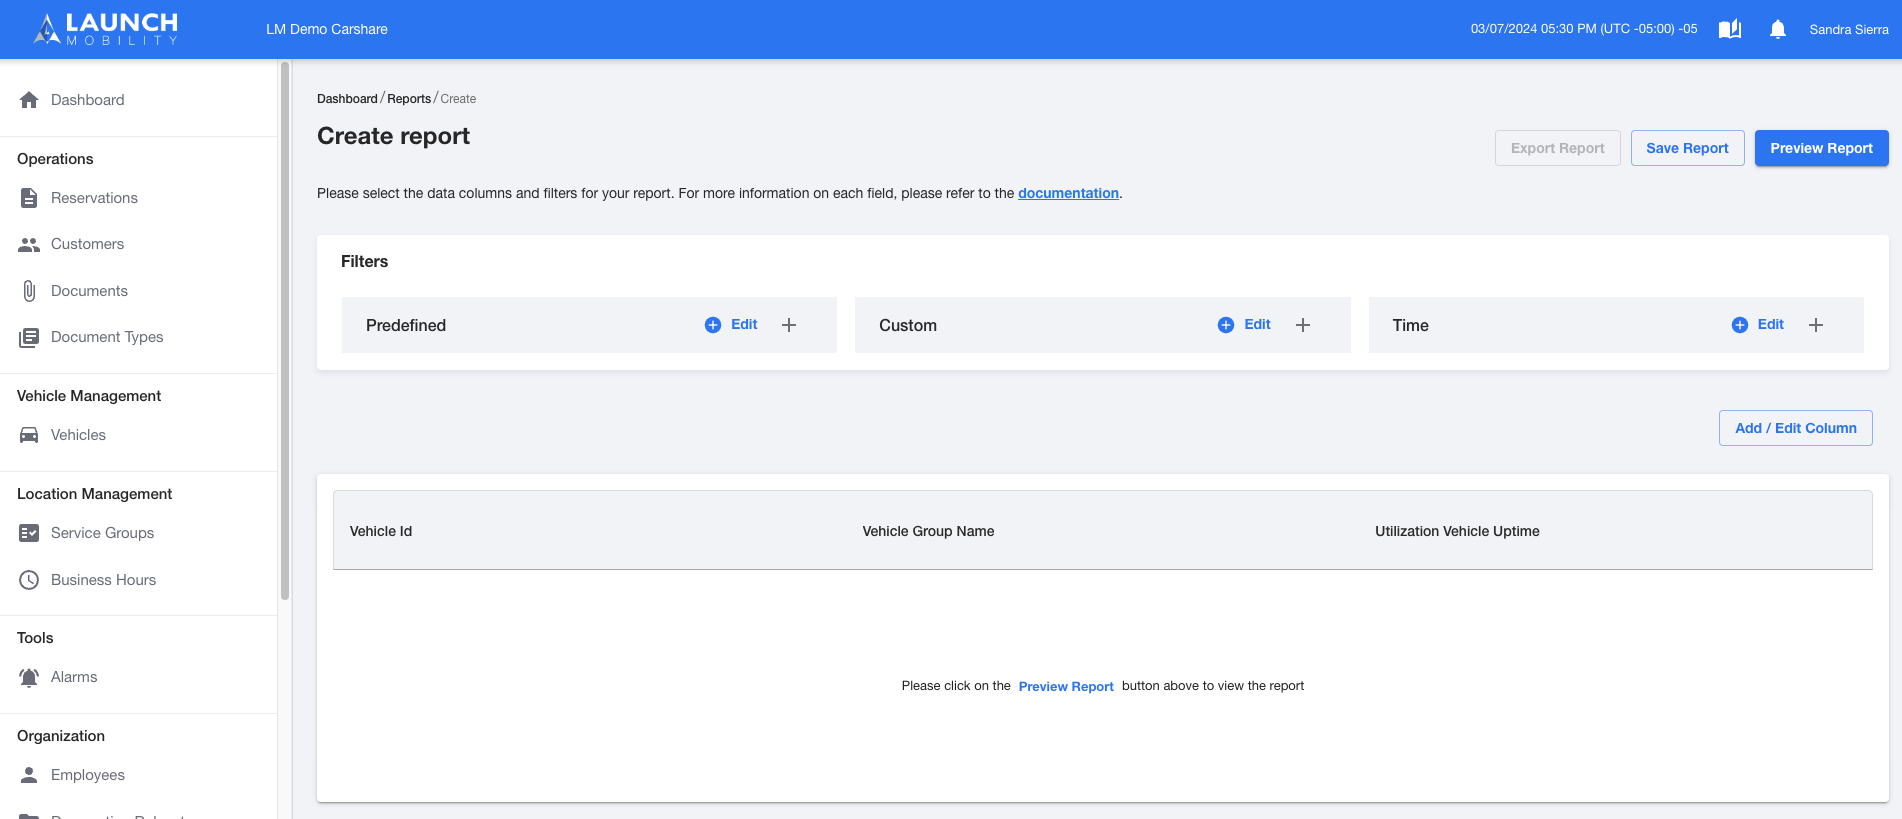
- Utilization/uptime
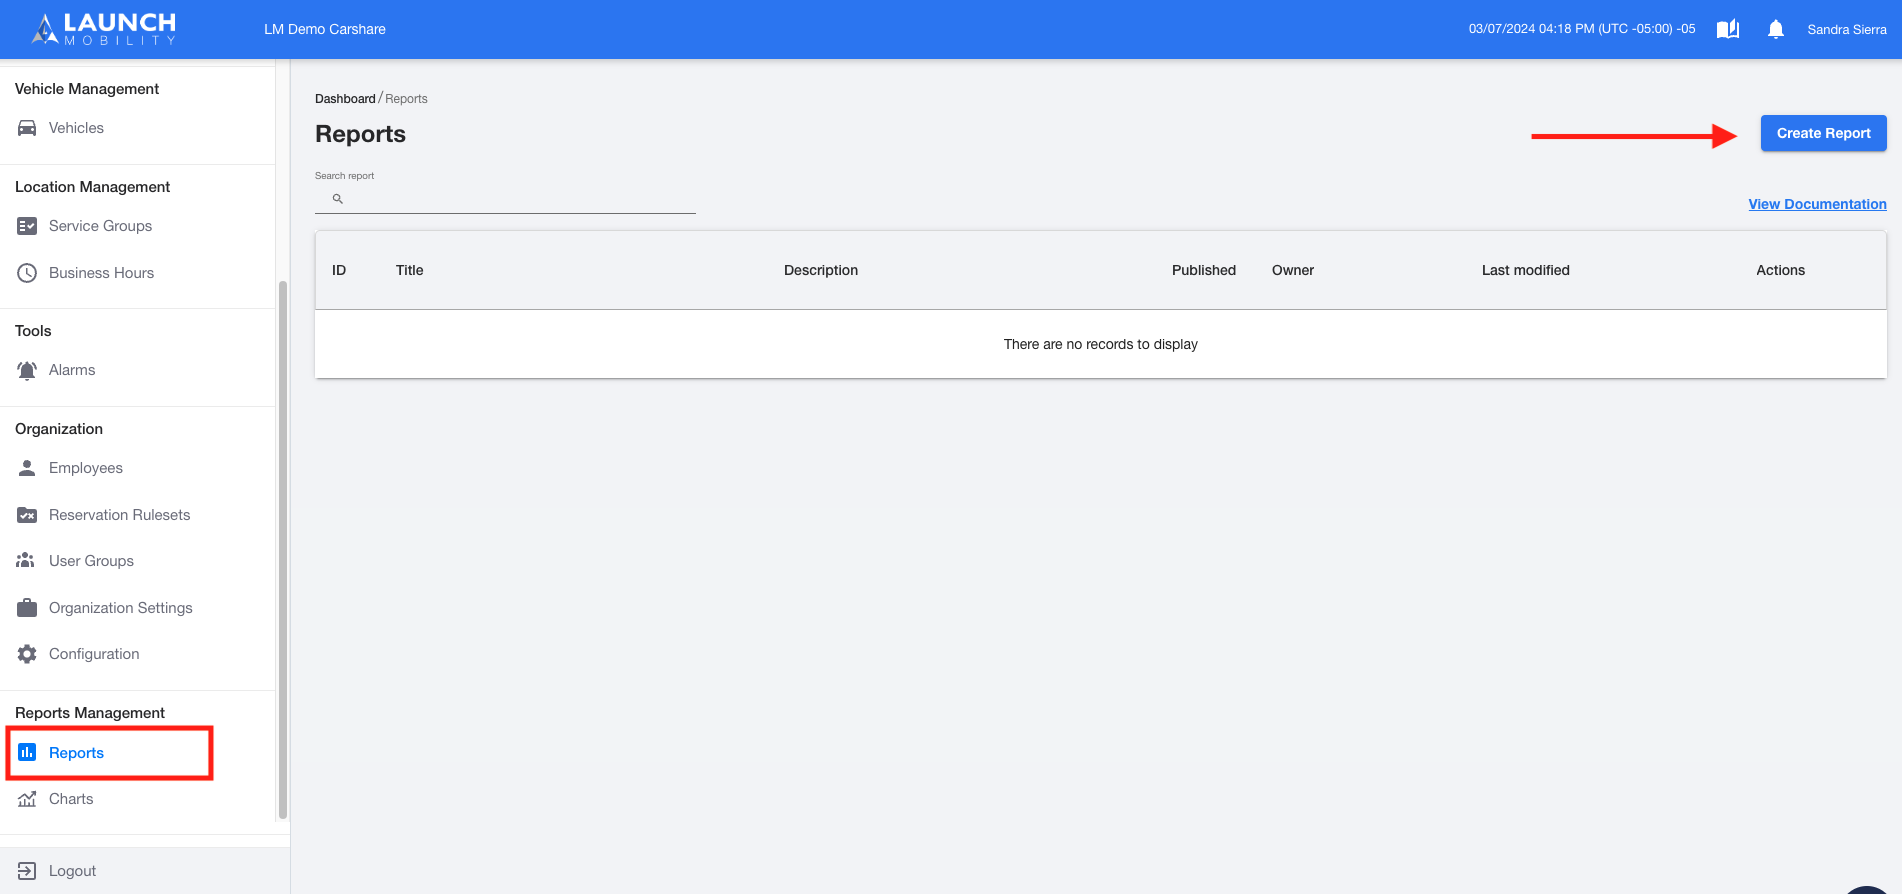
Step 1
In Service view, locate the “Report Management” section in the navigation menu, then select “Reports”.
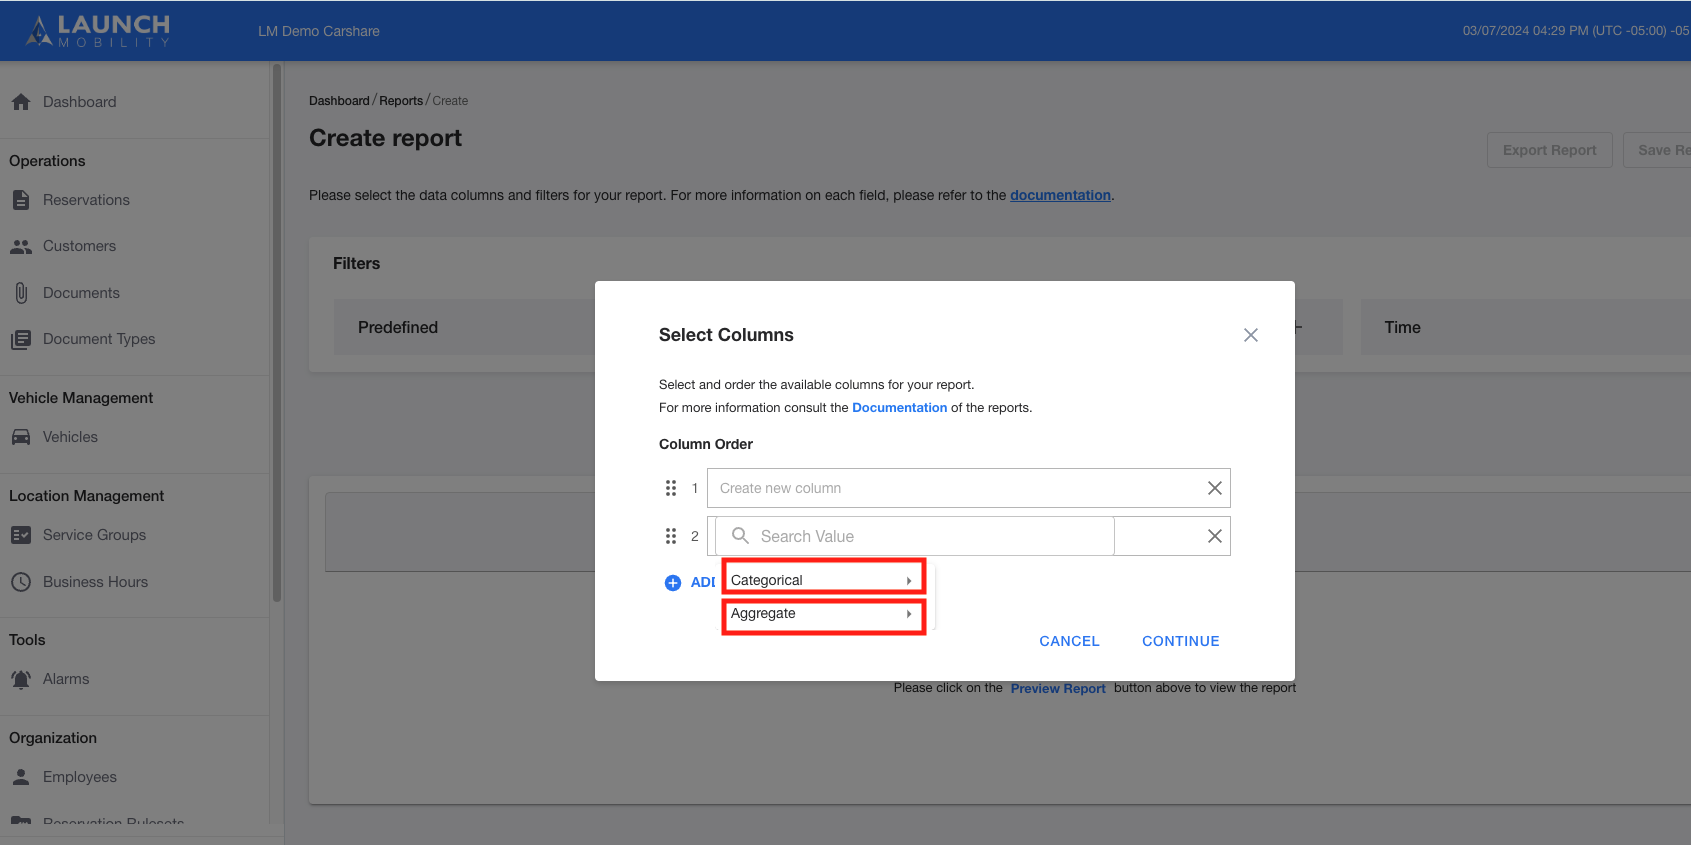
Step 2
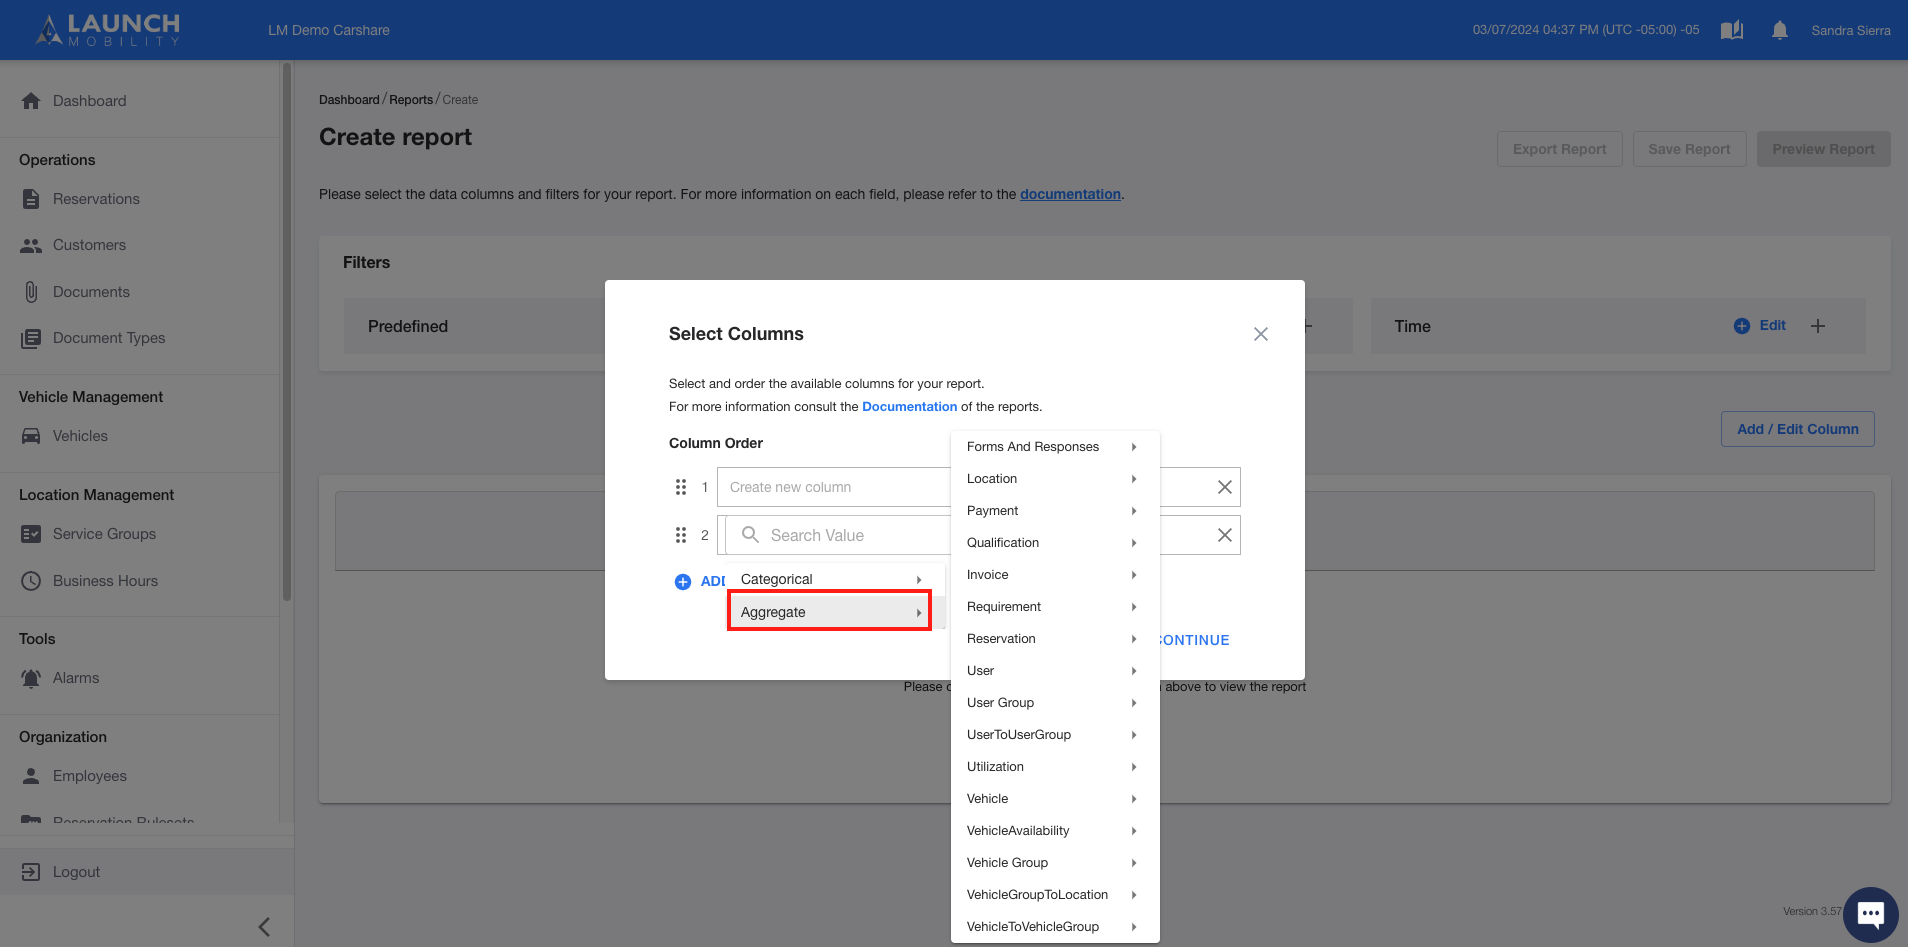
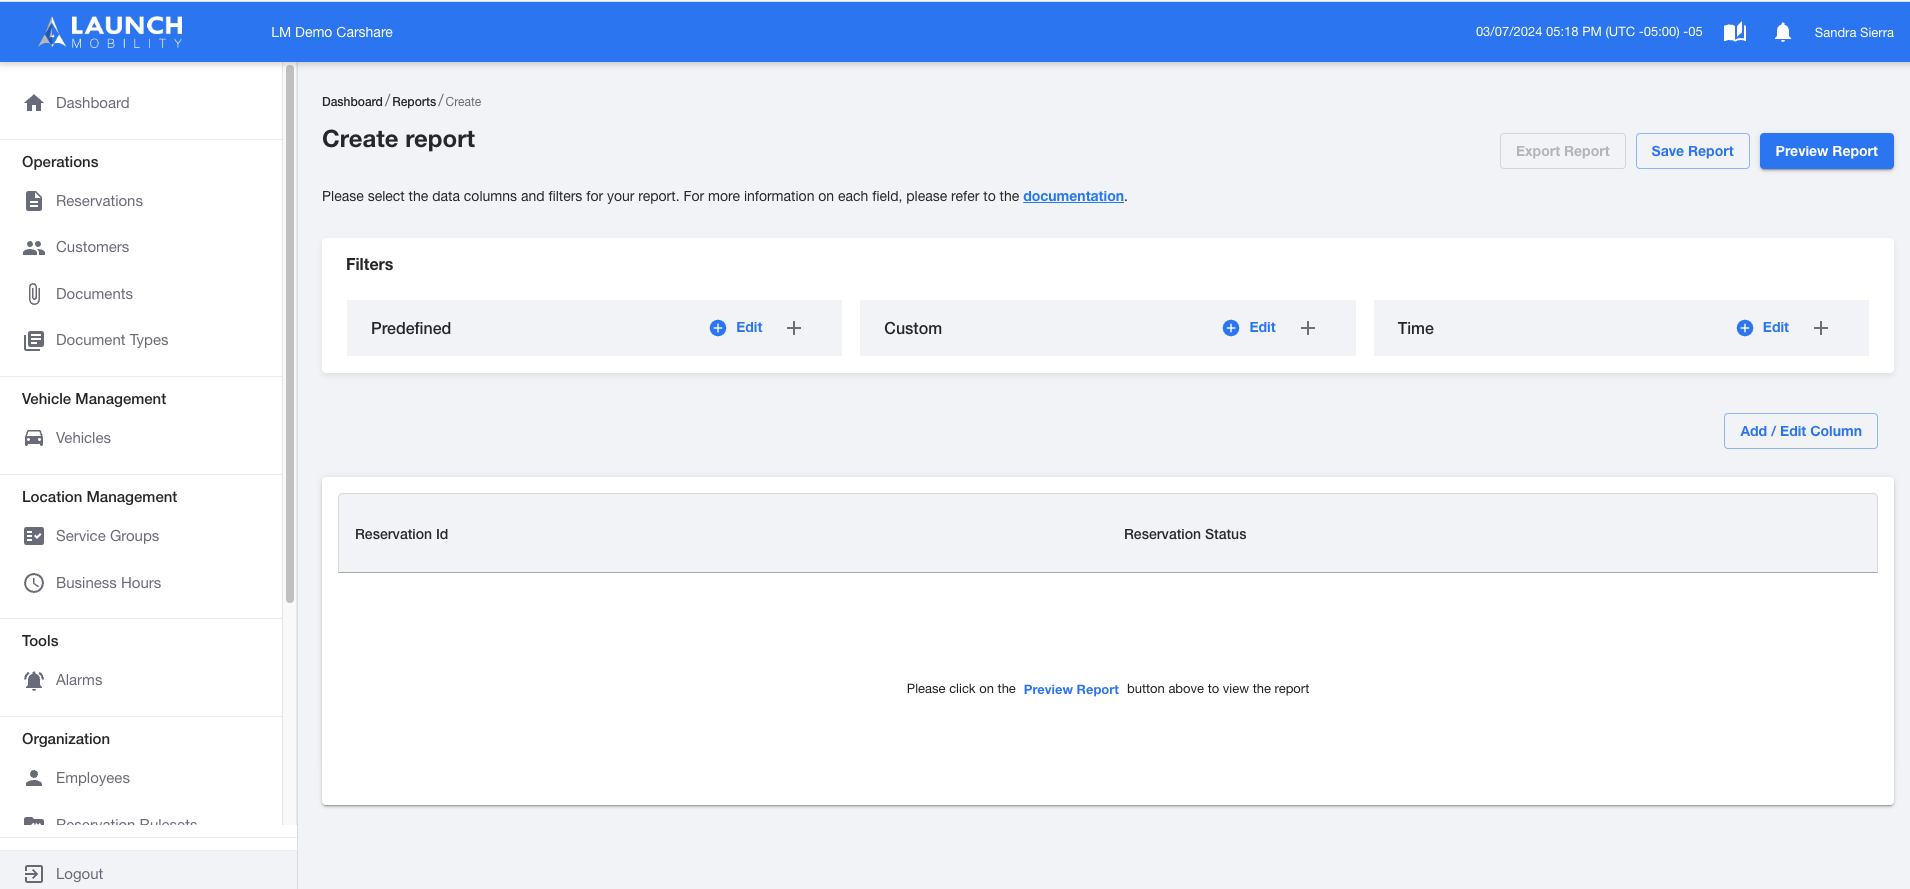
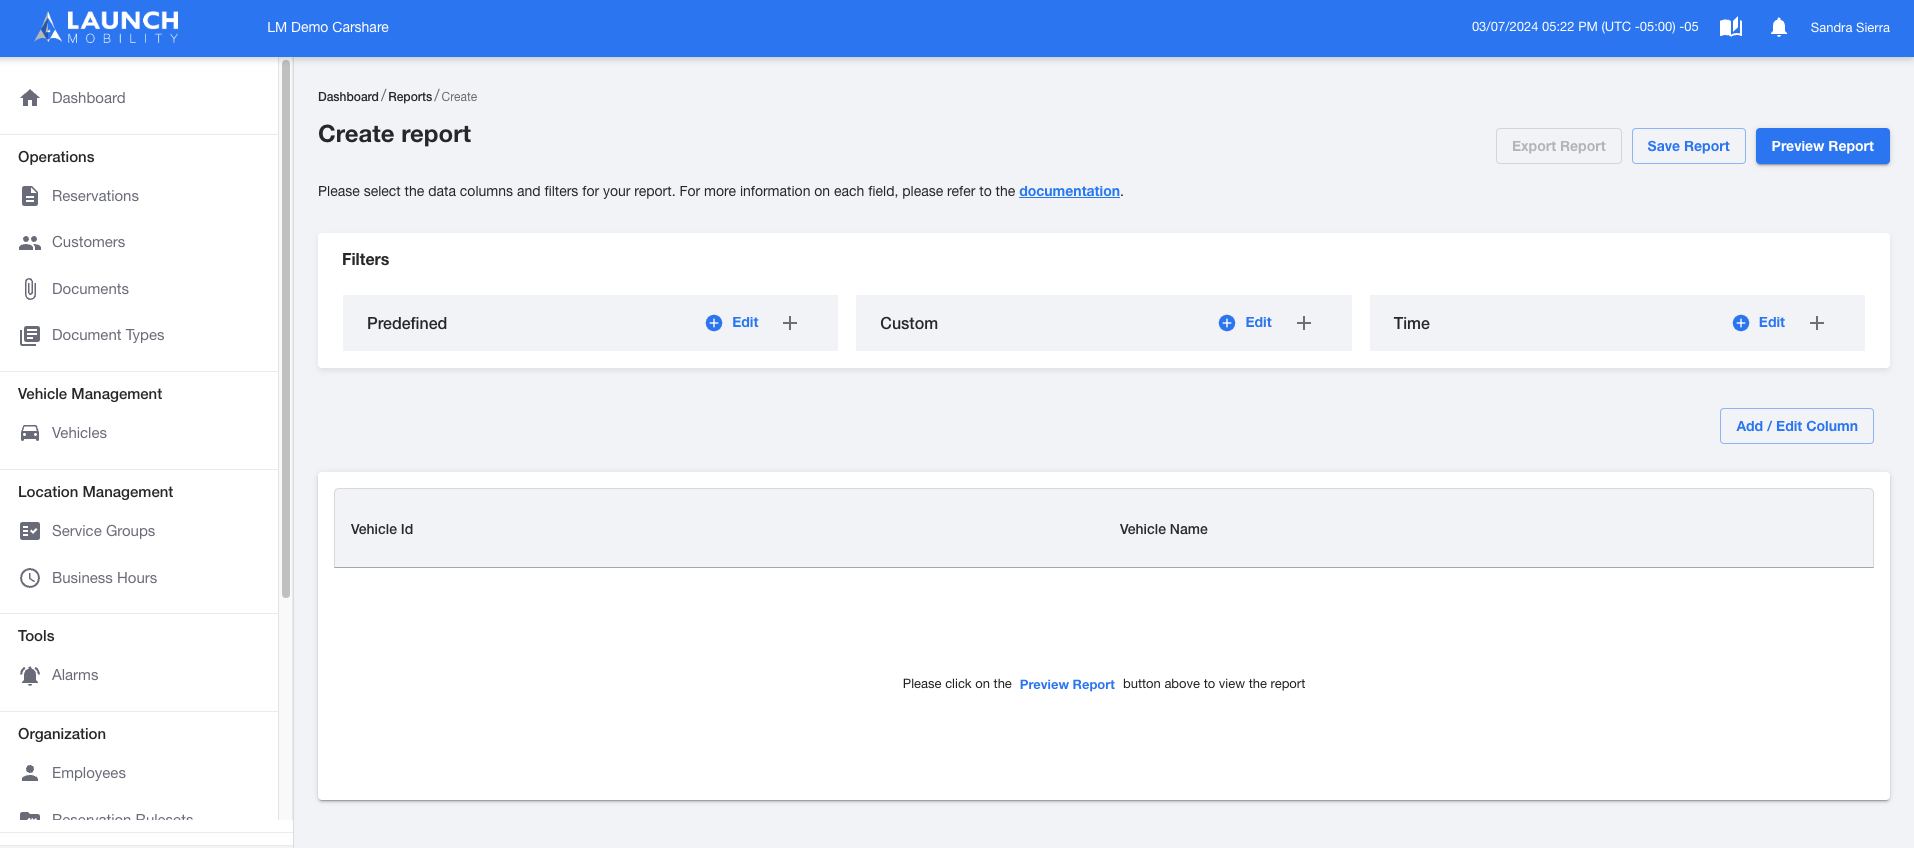
In the Create Report screen, please select the columns of the reports that you want to create. Could be Categorical or Aggregate
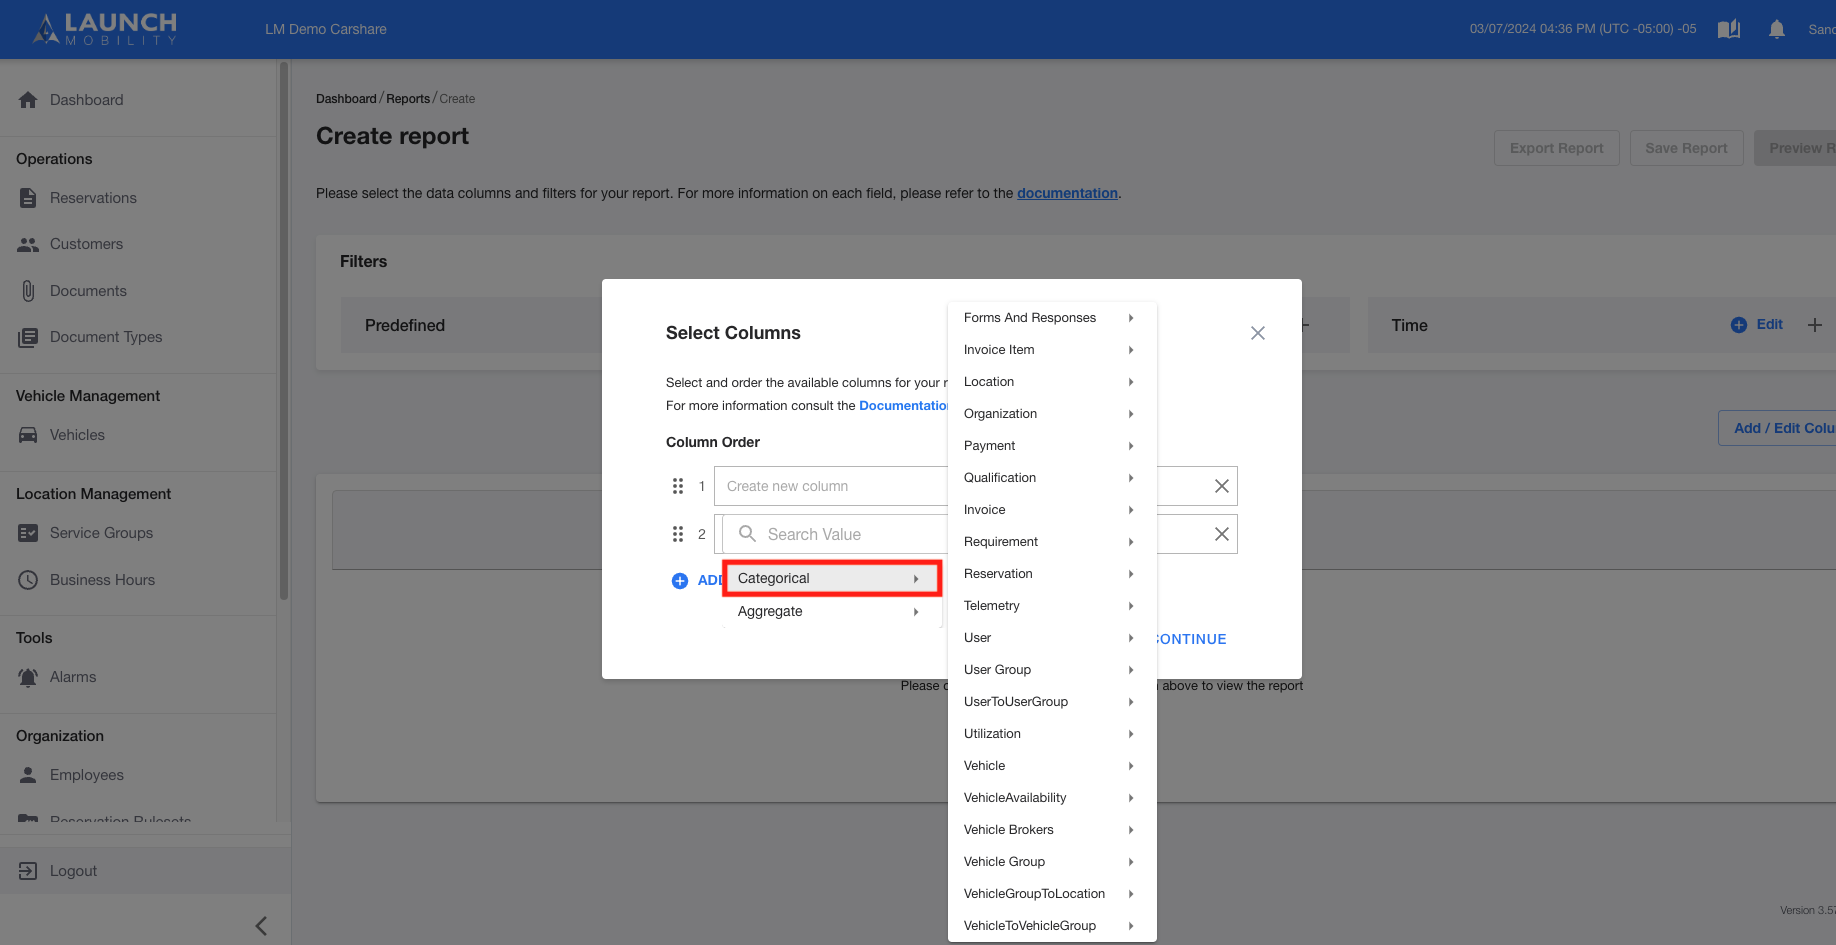
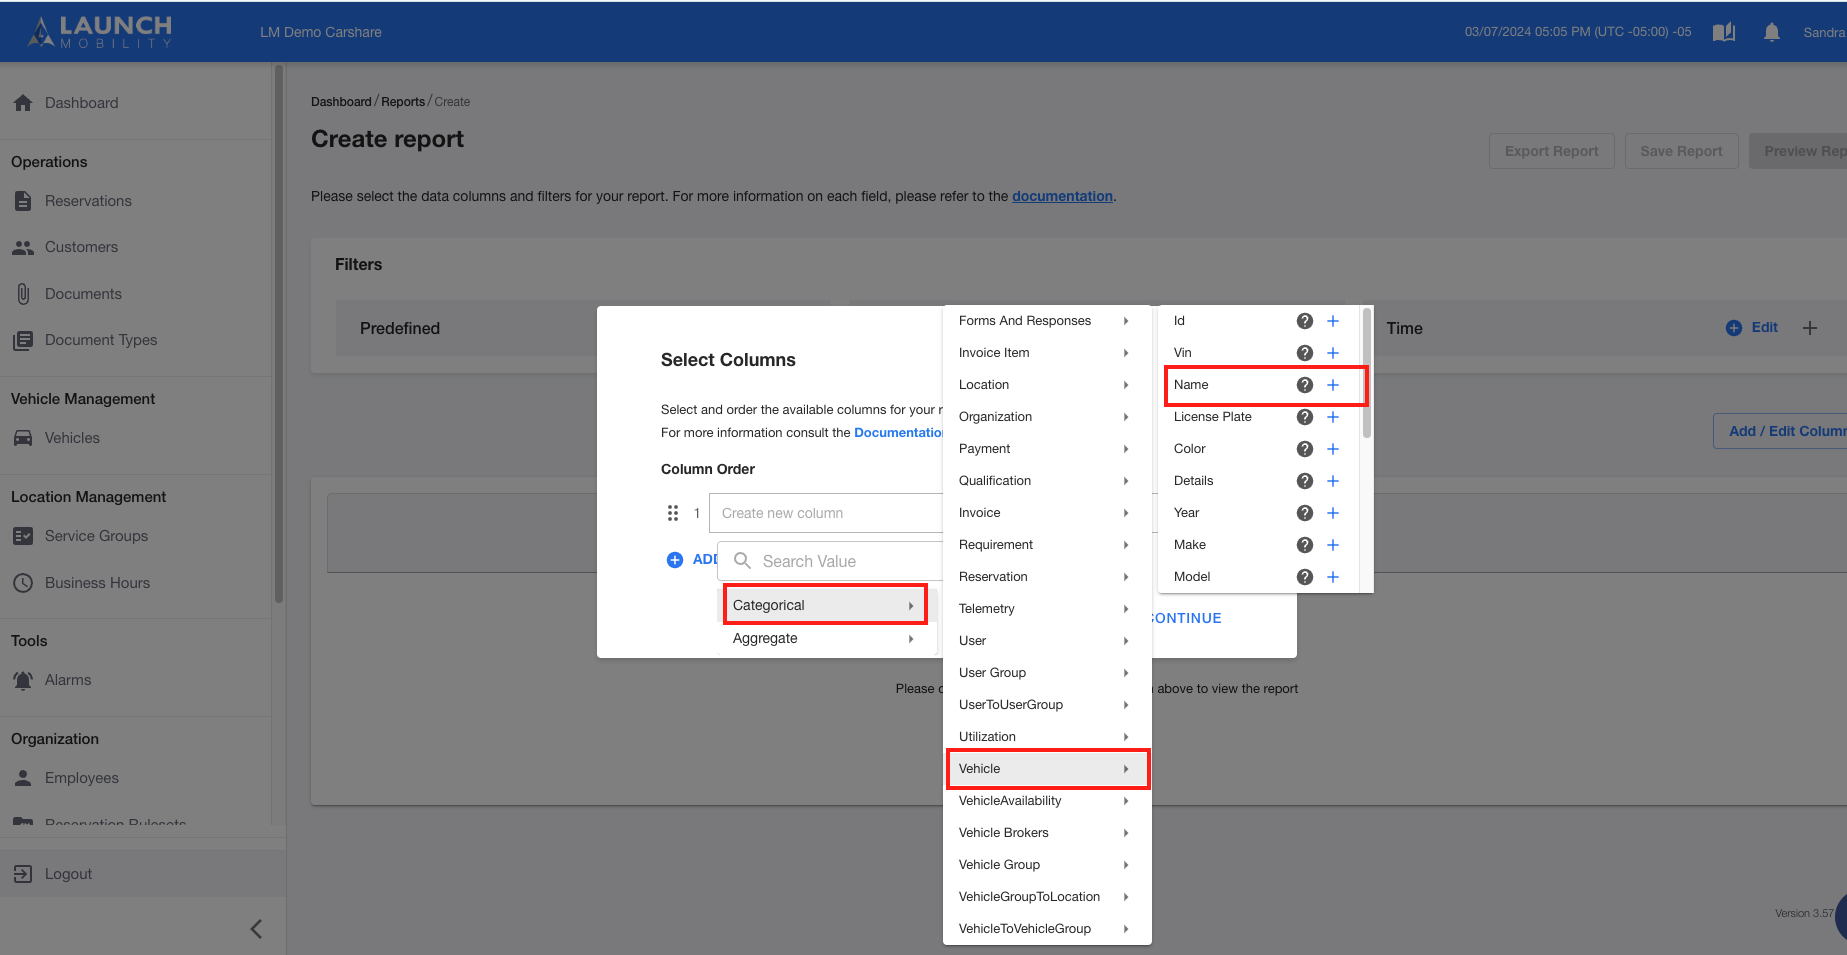
Step 3
Categorical options : *Categorical data is a form of qualitative data that can be grouped into categories
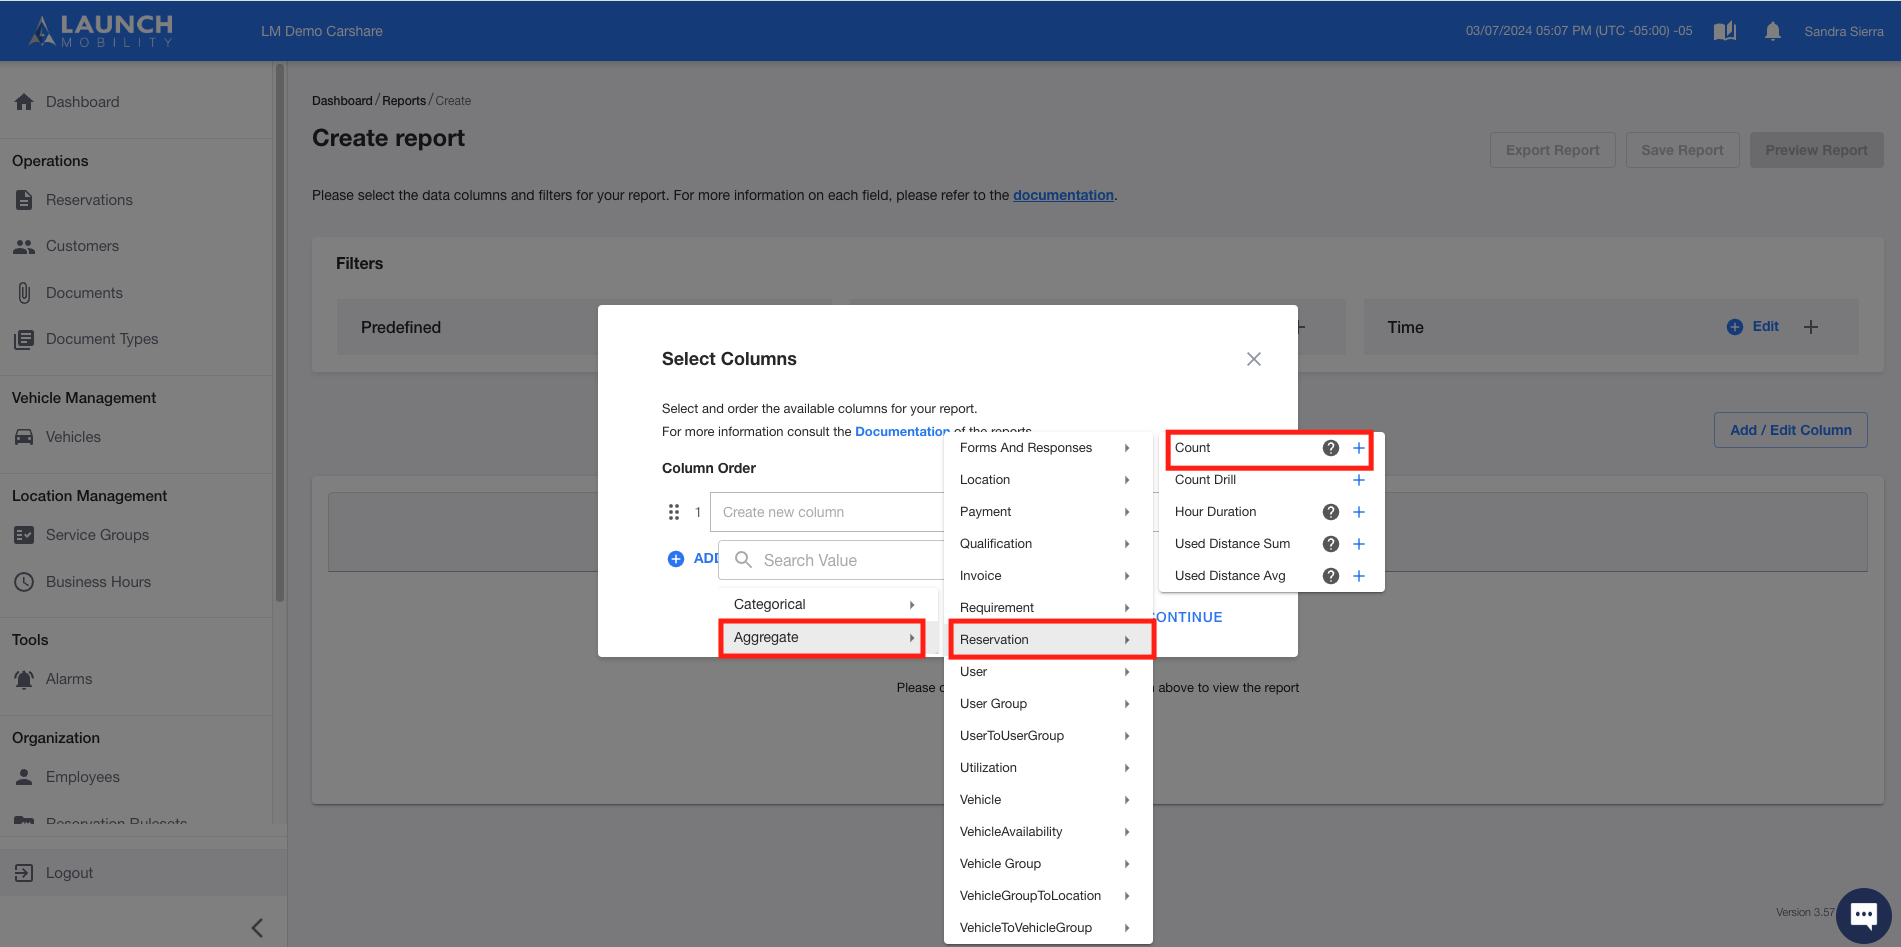
Step 4
Aggregate options: *Aggregate data is to compile and summarize data
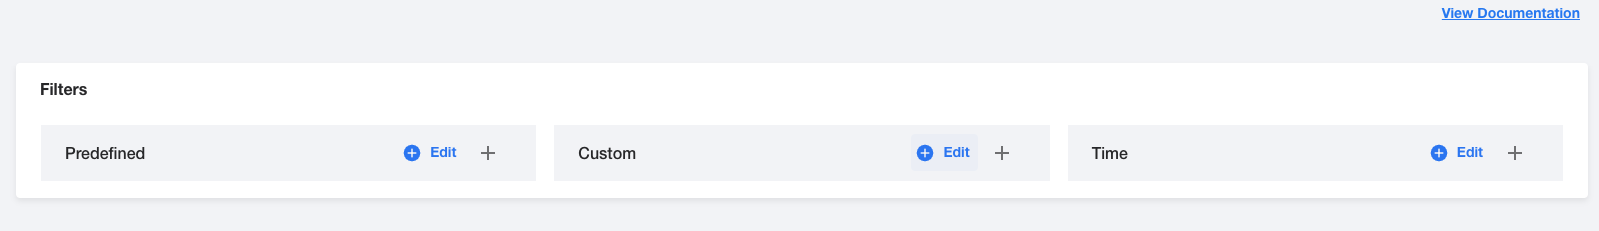
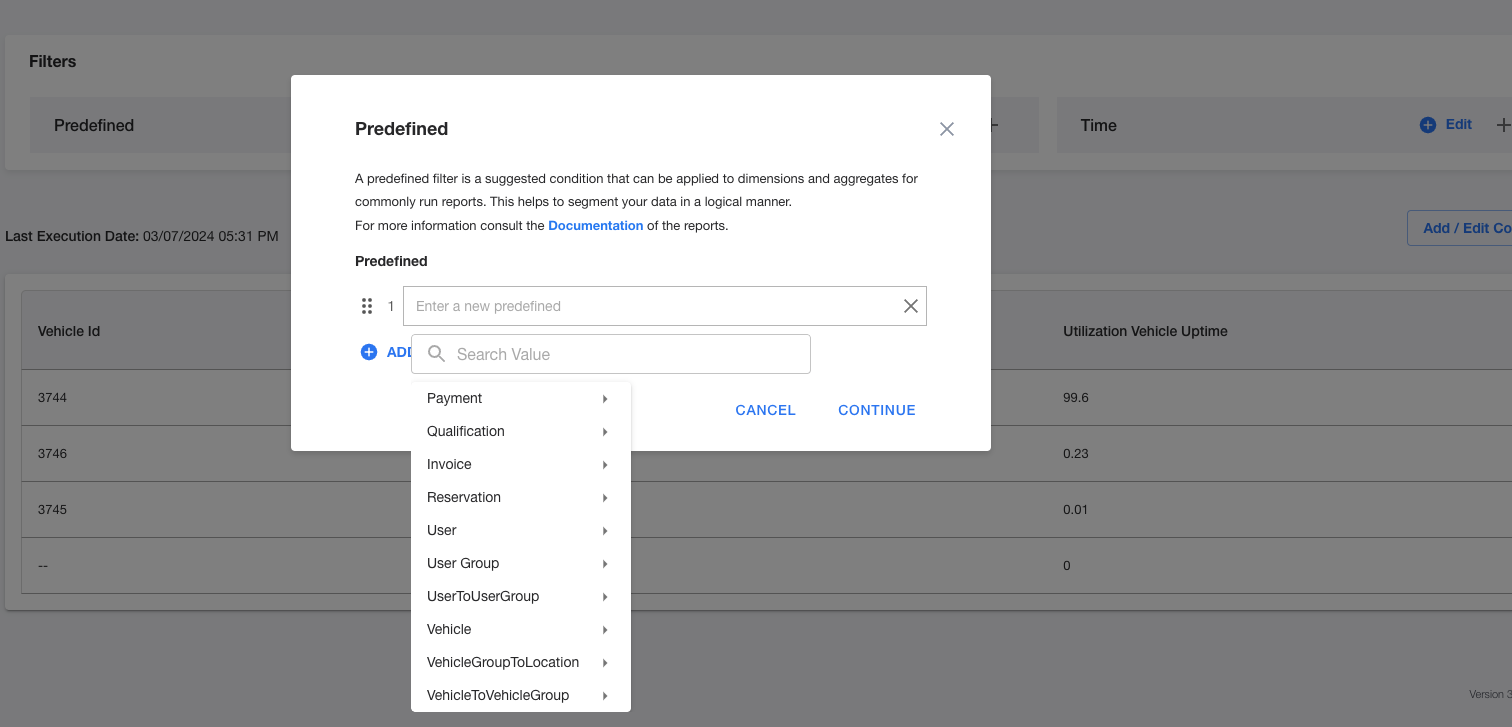
Step 5
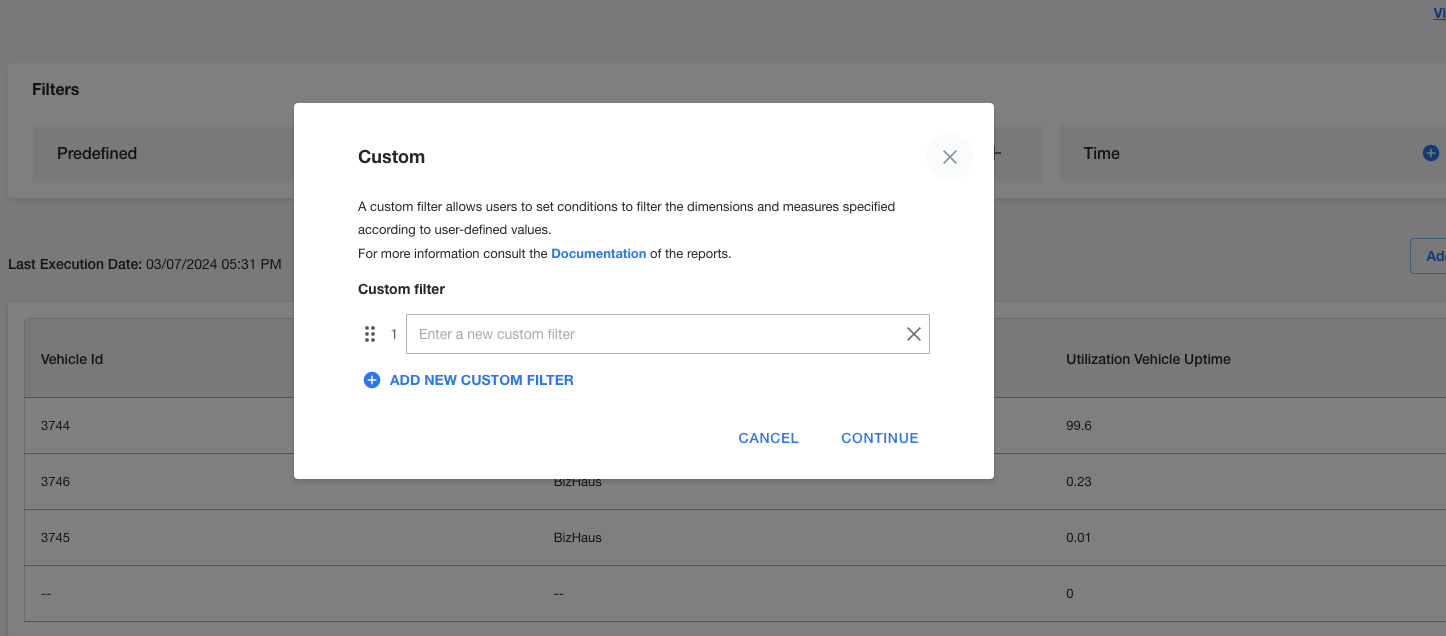
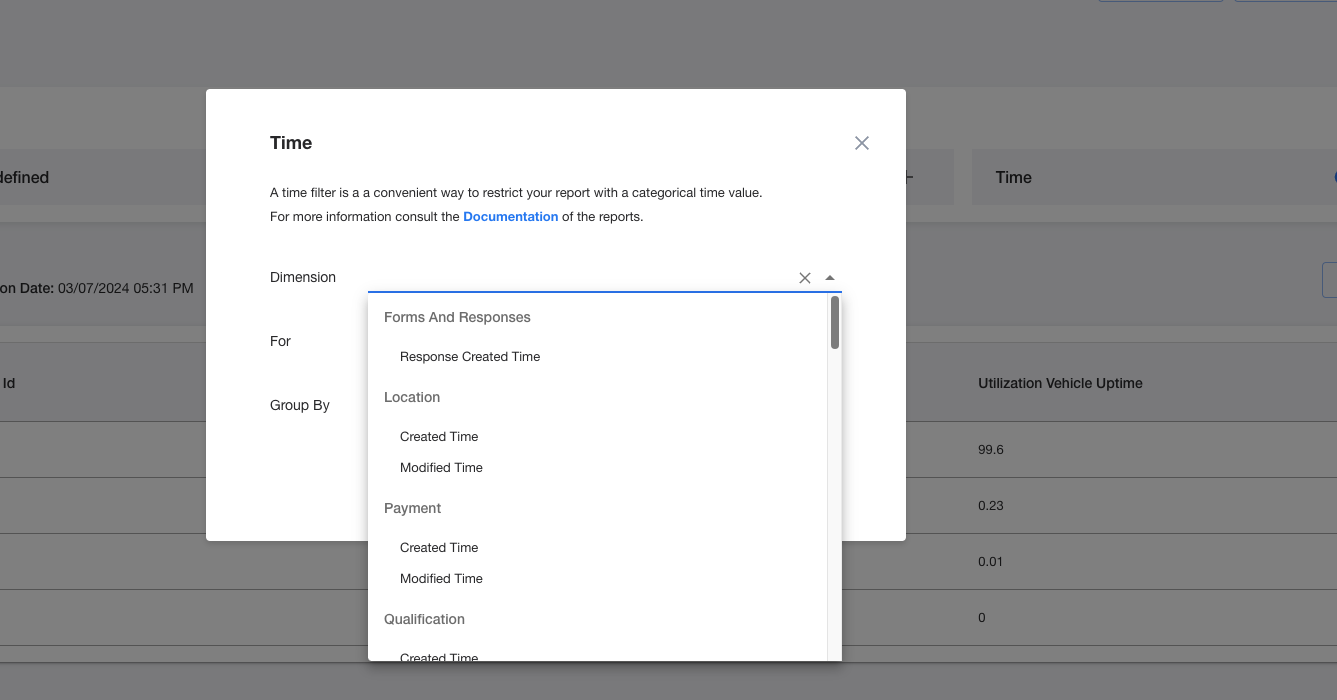
Filters :
If you have any further issues or need additional assistance please contact the support team.
Please note: If you’re looking for Service Groups in the Categorical or Aggregate options and can’t find them, it’s because—behind the scenes—Service Groups are counted as Vehicle Groups. To include data for Service Groups in your reports, simply select the Vehicle Groups option.